Exploration of trends in Billboard Hot 100 songs using echonest's acoustic features.
We all know that Billboard maintains charts of almost every type feasible. One of the most important is the HOT 100.
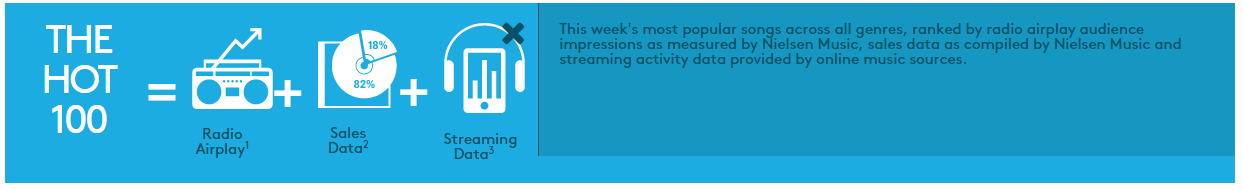
HOT 100 basically tells you what single (not album tracks) songs are Hot right now. Image below (click to zoom) shows the current evaluation scheme for the songs (taken from Billboard).
Billboard started maintaining this chart in 1958 and you can basically go through the whole history on their website. Well 1958 to 2015, you can easily smell a huge variety of records and interesting trends here, and there definitely are. Follow this Wikipedia link.
I scraped the whole history of HOT 100 starting from August 09, 1958 (Poor Little Fool, Ricky Nelson) to June 06, 2015 (Bad Blood, Taylor Swift) to see what else is interesting here and there apart from the obvious records.
1. Stays
One thing I was interested to know is the nature of stays in the chart. My belief was that over the years, there must be some changes in the number of weeks a song stays in the chart. I started by gathering all the songs and the week they entered the chart. Now, leaving the ranks they acquired, I just counted the number of weeks the songs were having a place in the chart and grouped them year wise (the year of entry).
Here are the plots. Ignore the trends in the extreme ends of the plot since the recent songs still are spending time in chart, while the oldest songs were abruptly inducted.
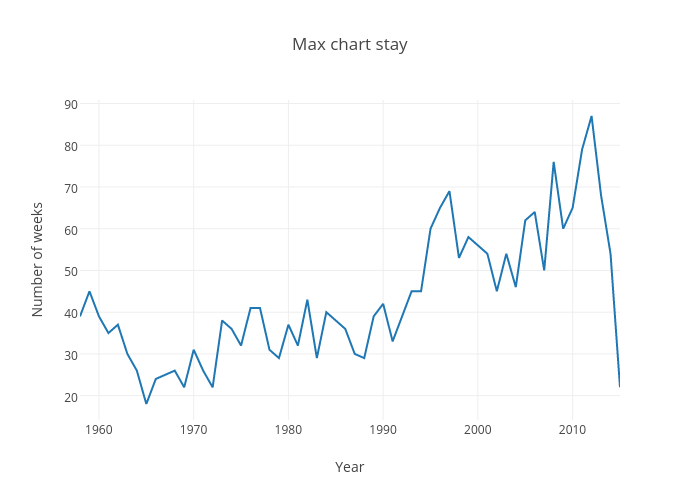
The max stays have increased over the years, with the peak being 87 weeks (Radioactive, Imagine Dragons, 2012). Maybe this is because of the whole internet thing, things grow in popularity when you have a better communication.
A more interesting thing to look out for is the mean and standard deviation of chart stays.
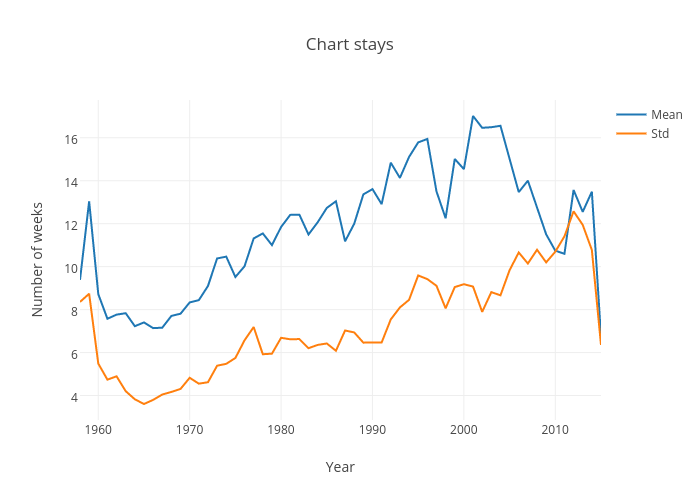
Here also the same trend is there, a higher mean tells you that songs are staying longer. Also the standard deviation has increased signaling the disparities in popularity.
2. Words
I also tried to find out how many times particular words enjoy presence in the
chart. Basically I gathered the count of words (nltk.tokenizer) in the song
titles from the whole chunk. Here are the top 20 words (removing the usual stop
words).
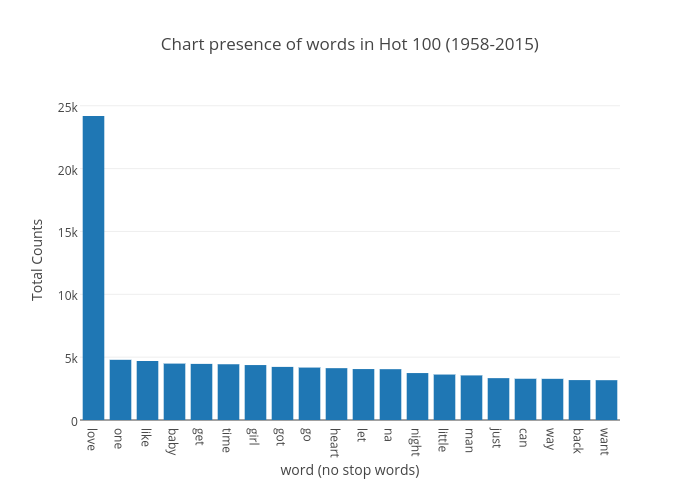
Nothing interesting here apart from the classical conclusion of Music being so lovesick. I also ran this year wise, but leaving the occasional shuffling of few words, nothing really interesting came out. Let's move on.
3. Acoustics
Why not go with the acoustic attributes of the music themselves ?
By acoustic attributes of music I mean properties that define the music and its components as perceived by your subjective senses. One example can be (let's say) a value that signifies the sadness of songs.
Echonest has exactly what we need. An API that provides you access to the acoustic attributes they maintain for their (really) huge music database. Also, the attributes have real subjective meanings too. You can see this from the attribute names like acousticness, instrumentalness etc.
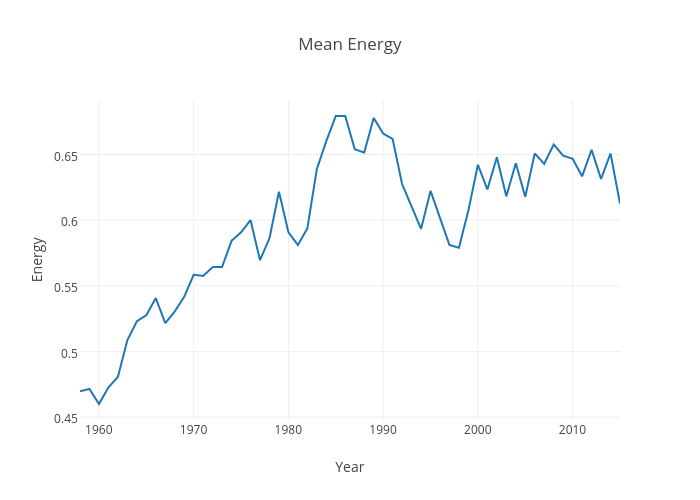
In what ways can they help? Actually, in a lot of ways. But let's start with the most obvious thing first. I gathered echonest attributes for all the Hot 100 songs, from 1958 to 2015 and went on to plot the year wise mean of 9 acoustic attributes.
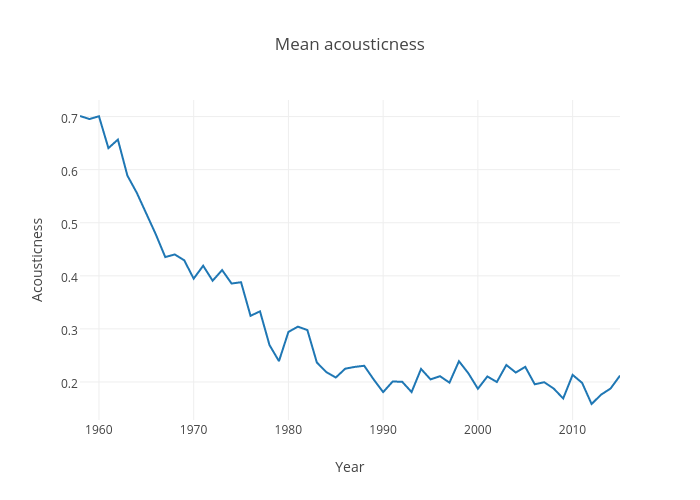
3.1. Acousticness
Higher values mean higher content by vocal or acoustic instruments.
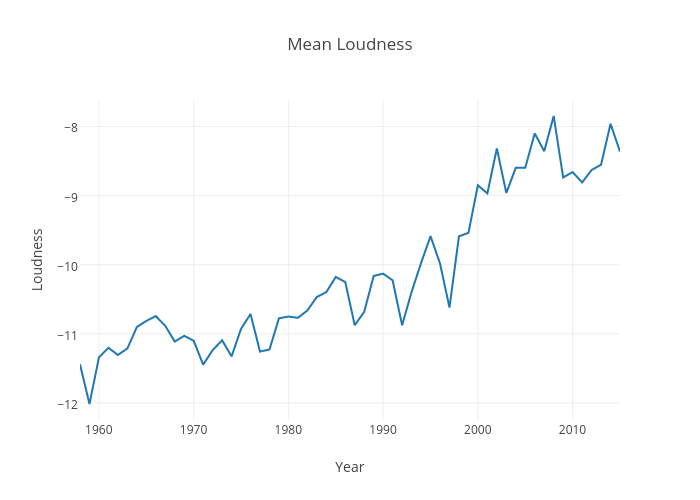
3.2. Loudness
You know what that is (in dB).
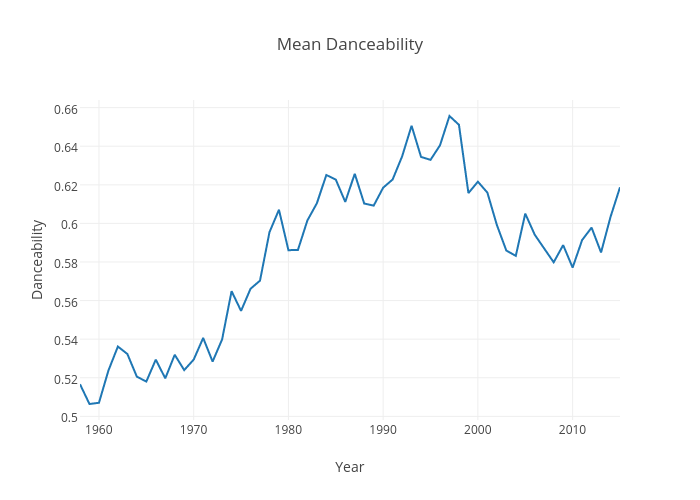
3.3. Danceability
You can guess this too.
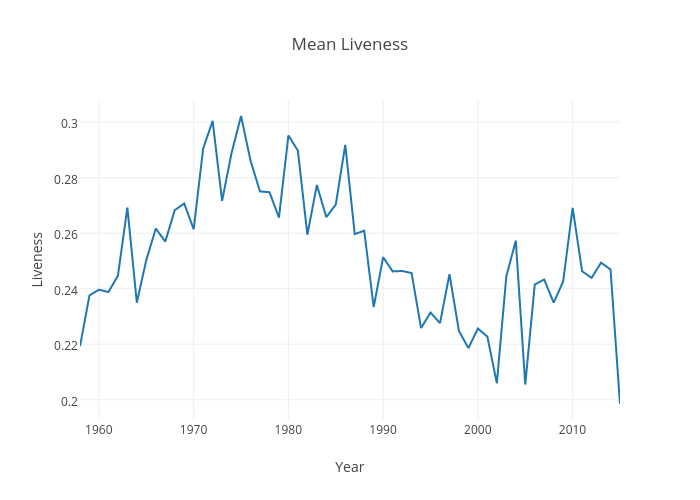
3.4. Liveness
Higher values indicate more audience effect (as in live tracks). Though this property has significant meaning only when it is high.
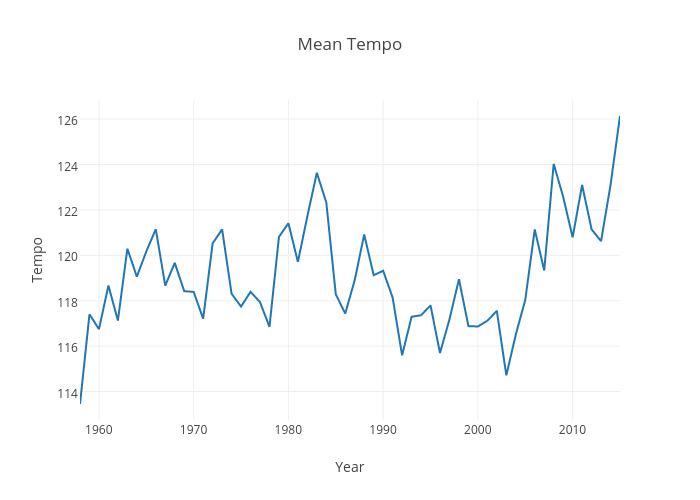
3.5. Tempo
Beats per minute stuff.
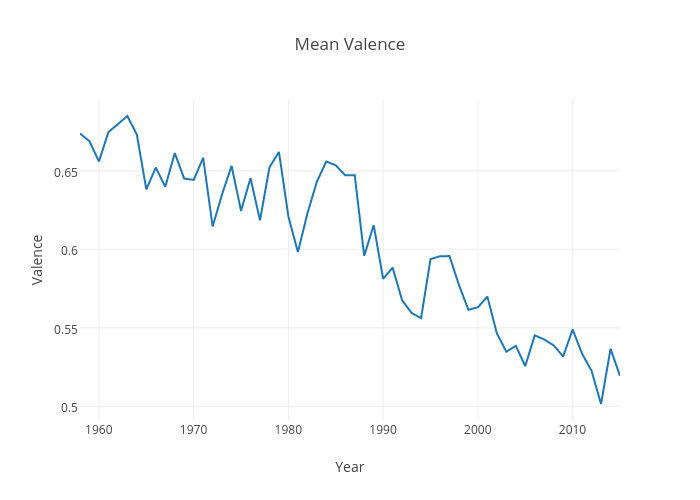
3.6. Valence
Higher value tells you the song is positive, lower value tells you the song is negative, sad etc.
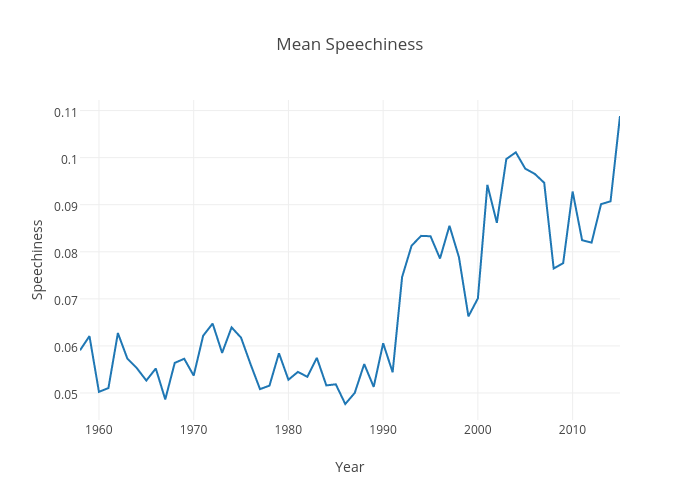
3.7. Speechiness
Spoken words content in the song.
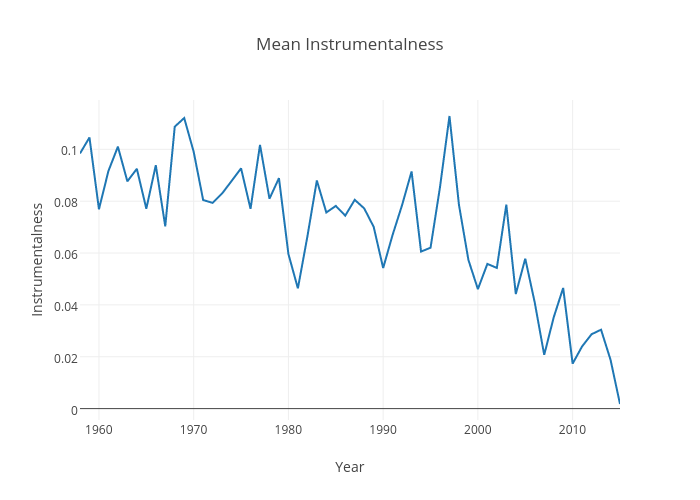
3.8. Instrumentalness
You can guess this too.
3.9. Energy
Intensity, power etc.
For getting the meaning of the numbers and the attributes, you should read echonest's documentations on the attributes, like this and this.
So, yes, you just saw the music trends according to the subjective acoustic attributes. There are clear falling or rising trends for few attributes. I don't know the exact reasons (clearly) for few very visible but not so obvious trends since I am not from the region where this whole playground is set (U.S.), but anyone with enough background could deduce meanings from these plots.
Acoustic attributes are awesome. There are lots and lots of ways you could analyze the trends using these attributes. For example I could try:
- Clustering songs based on the attributes and popularity (based on ranks).
- Analyzing the effect of attributes on songs which are quick to come and equally quick to go, or songs that stay really long.
- Predicting chart positions.
- Analyzing artist wise trends etc.
Though I have done a few of these, many possibilities are left untouched. Once, I get free with few things, I will try to push the results as a continuation of this post.