Exploring a new way to compare storytelling in classics by comparing changing signals in a word embedding space using dynamic time warping.
If you are a fanatic reader of a particular author, you can immediately identify whether a given (unknown) text is written by him/her or not. Apart from the idiosyncrasies and diction, the flow and development of text is particularly unique to an author. You can actually visualize a curve of rising and falling emotional cues like thrill, optimism, confusion in their works. Taking these works as signals can, in principle, allow us to compare the writing styles. This post tries to do the same using a technique called dynamic time warping on signals based on word vectors gathered from classic literary works.
1. Text to Signal
There are many ways to see text as a time series. I will use a pretty basic and intuitive technique with word embeddings.
1.1. Word Embeddings
Word embeddings provide projections of words from any language to some \(N\) dimensional mathematical space. In simple terms, it provides a vector for each word it has seen. The vector is learned in relation to the context in which it appears. A popular method uses Continuous Bag of Words and Skip-gram and has a python implementation in gensim (Word2Vec).
An excellent primer on the topic is on the blog of Christopher Olah here. This vector representation does two things for us:
- Gives us something much more amenable to mathematical analysis, numbers.
- Arranges the words in vector space according to the semantic meanings.
A sample of 1000 words from a 100 dimensional word space (t-SNE/ed/ to 2 dimensions) after training on Project Gutenberg's 1000 ebooks is shown below. Although the words look mostly archaic, lookout for nearby words with semantic connections (hover on dots).
1000 words from a 100-D vector space
1.2. Cramming text
After training an embedding model (with 100 dimensions) and computing vectors for each word in a book, we are left with a matrix of size \(N_w \times 100\), where \(N_w\) is the number of words. One simple reduction strategy for \(N_w\) is to simply take sentence vectors by averaging out the words (though, we could have used Doc2Vec here, but let's go with this). For 100 columns, we can hinge to few fixed word vectors like romance, mystery and calculate cosine distances of the rows from these anchor points. But, since the word space coverage might be severely affected, a better way is to create anchor points in the number space directly.
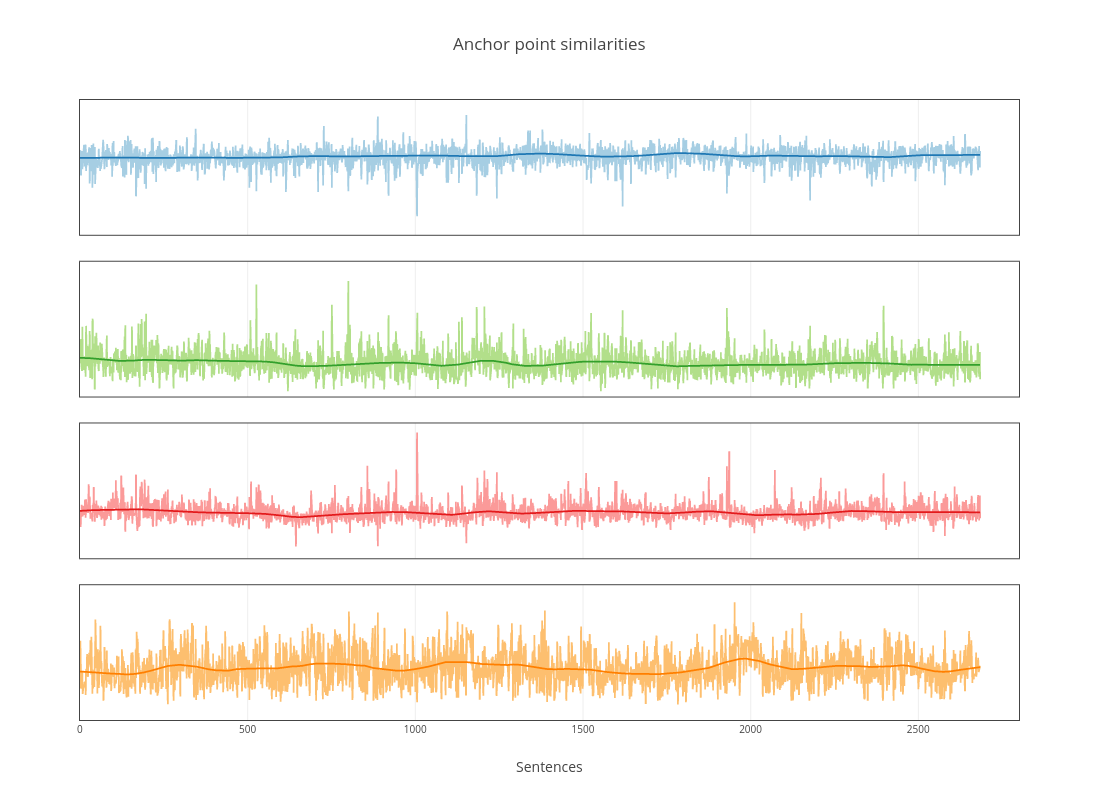
A simple K-means clustering with 4 centers provide us the anchor points and now the matrices are of size \(N_s \times 4\). Below is the graph for The Sign of the Four by Arthur Conan Doyle.

The smooth lines are generated after using a gaussian filter and they more or less capture the essence of the flow.
2. Comparing signals
Once we have set of comparable signals for each book, next step is to do actual comparison. A simple way would be to extract some sort of features from these time series or directly apply techniques to learn from the series. But, let's try something more crude and direct.
In time series analysis, dynamic time warping (DTW) is an algorithm for measuring similarity between two temporal sequences which may vary in time or speed.
In short this is what we want. DTW has simple working principles and is invariant of length and positions of peaks and valleys in signals. The pseudo code on Wikipedia should get you started.
2.1. Distances to coordinates
Once we get the distances, we get 2D cartesian coordinates using Multi Dimensional Scaling (MDS). Although we won't talk about this here, MDS is a cool thing to look for in data visualization.
Anyway, here is the scatterplot of 24 classic books.
24 classics clustered according to similarity calculated using the DTW method
Jane Austen gets a personal space of her own. Mark Twain looks versatile.
One thing that personally worries me while reading fiction is the easy predictability, not of facts (which doesn't hurt), but of what will happen next in a global emotional context. Reading The Lost Symbol made me feel like I am reading Digital Fortress all again. Hopefully, this won't happen again.