In a previous post, I made the following statement:
… an interface for plotting data in common ways is possible with an AI writing throwable Matplotlib code on every prompt.
A few weeks back I tried putting up something together to check the validity of this statement. MatplotLLM is the outcome from there. Check out the GitHub link to understand how it works.
Here is me trying to replicate a plot from my last month's post.
Now this tool is obviously a stunt1 and if you really use it, you will find a lot of frustrating expectation mismatches. Here is another clip where I was trying to get marginals plotted in a scatter—which it has done correctly 2-3 times in the past—where it broke in a weird way2.
Coming to my original statement, I would say that it's possible to add a usable natural language layer for common plotting needs. It's not MatplotLLM, but it could be, given a couple months of dedicated effort. But extending it to custom visualizations with good user experience will take a lot more work.
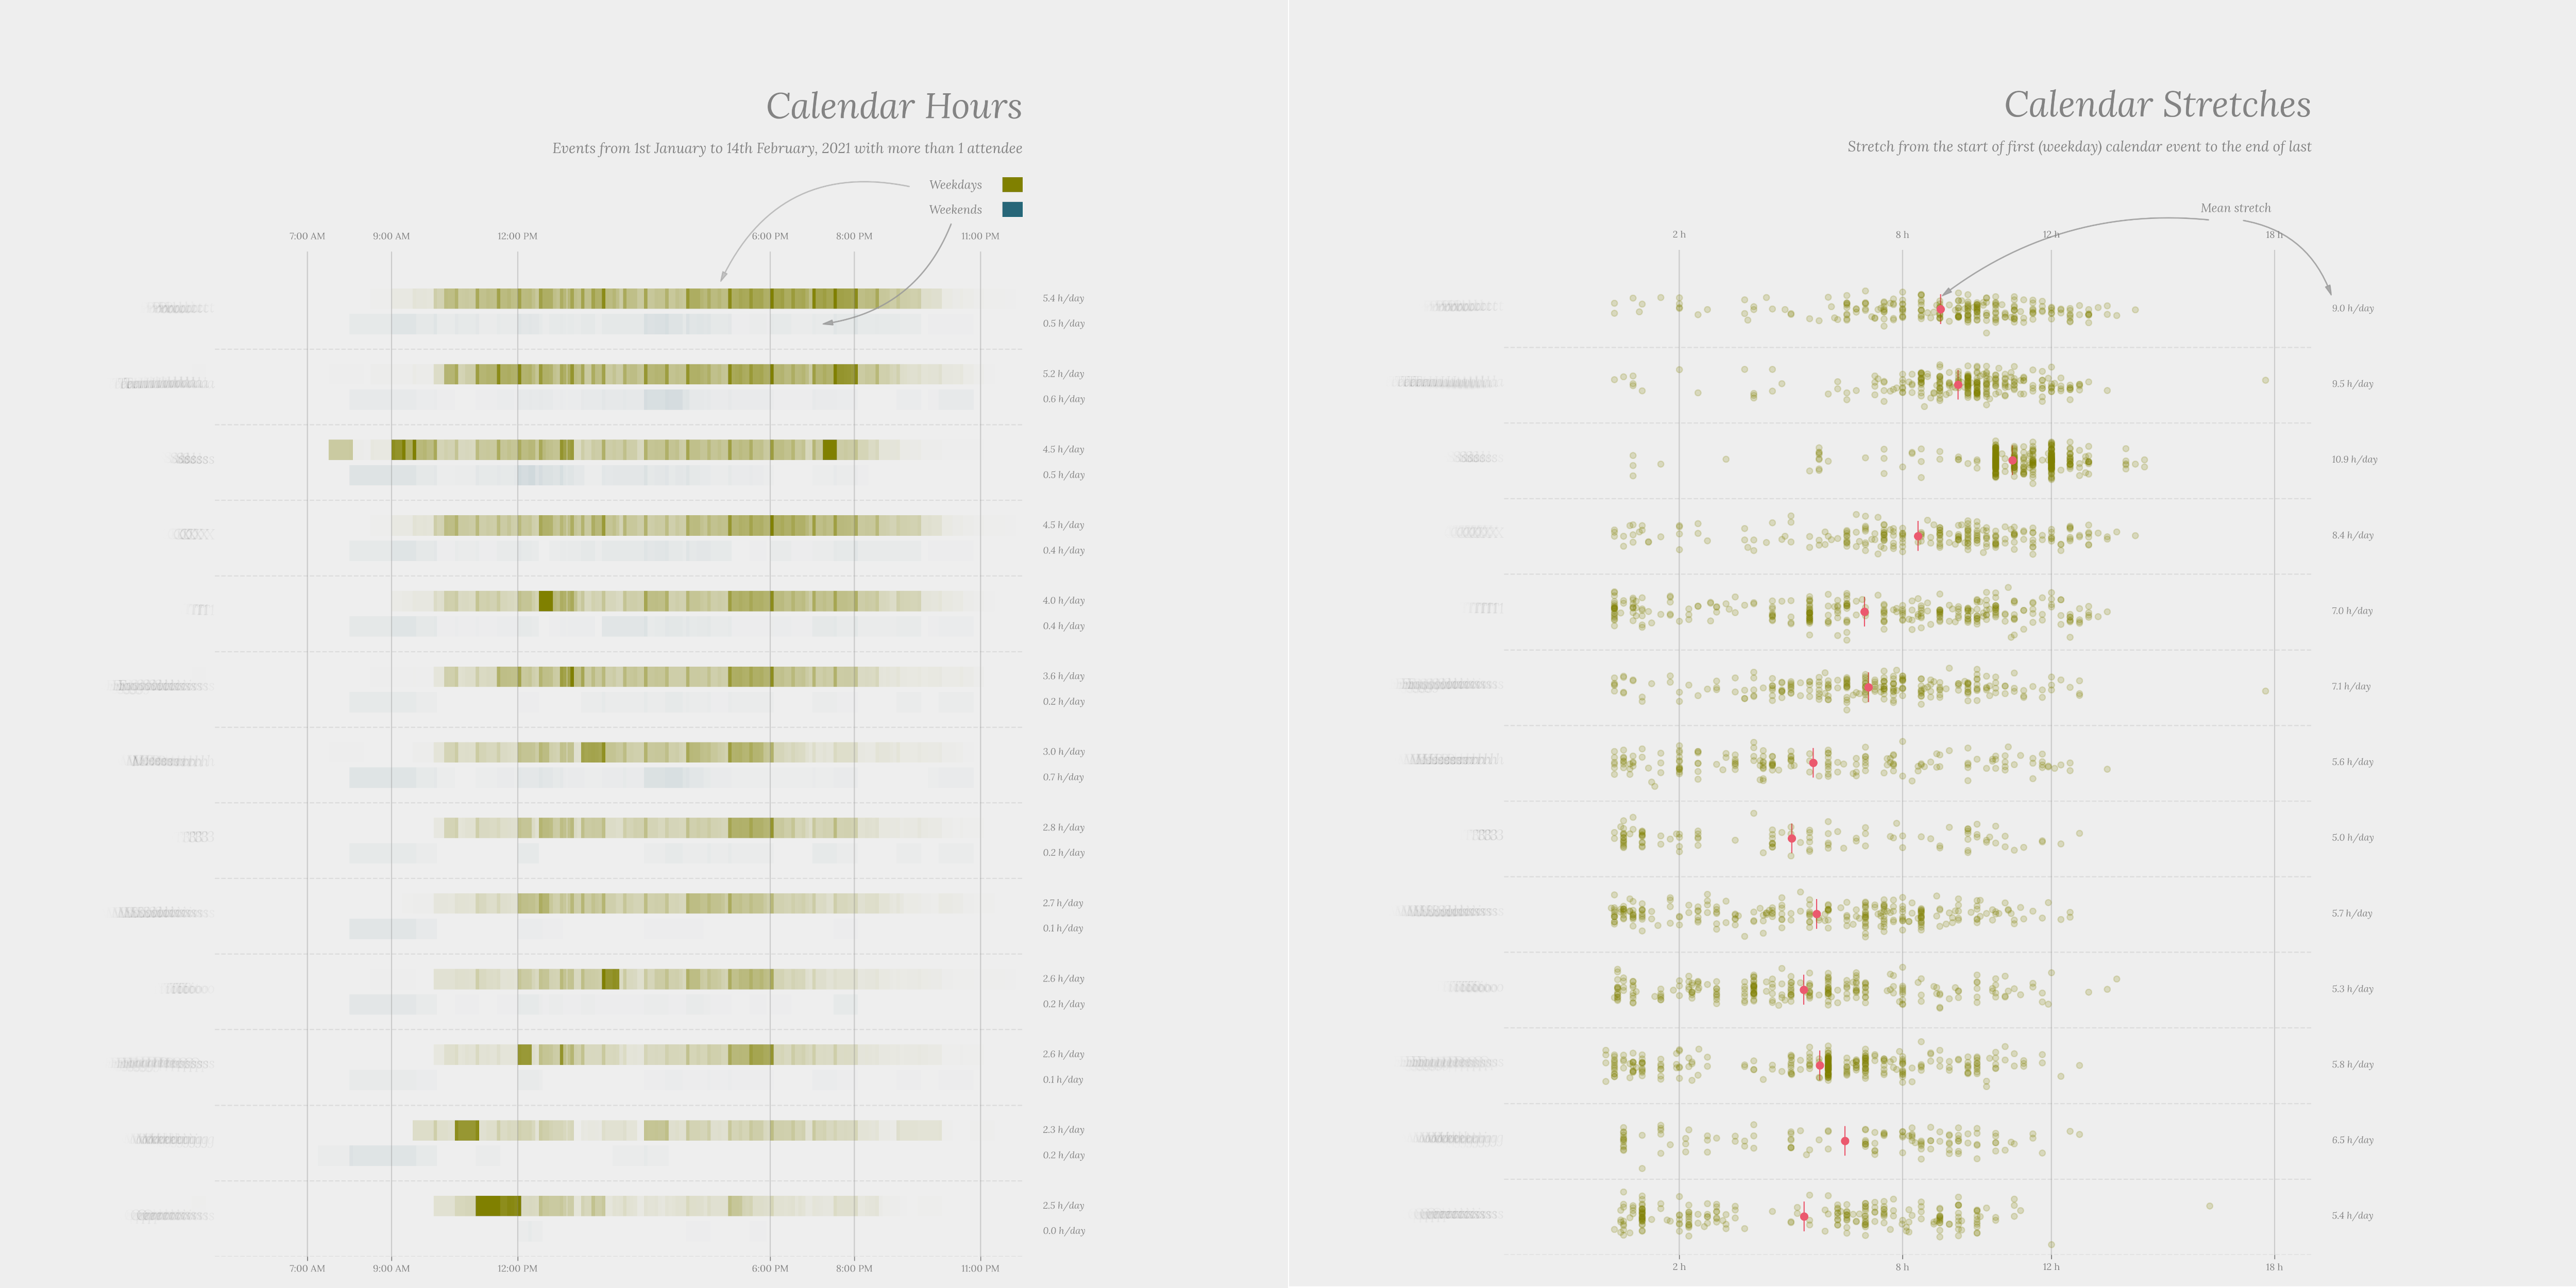
My larger motivation is to be able to make custom and beautiful data-stories without needing to hand-write Matplotlib (or D3 for that matter) code. Here is an example plot that I would like to generate, but I can't do that with MatplotLLM right now at all.

You might see many AI integrated BI tools these days but none of them, as far as I know, are doing anything on visualization in the way, say, a data-artist3 would need. Most are about AI-glue-coding data schema with standard plots. So overall this still looks like a relatively under explored area.
Technologically, we need a fast LLM that has awareness of visualization primitives, concepts, and principles, most likely a custom model and not text-only GPT4 like used in MatplotLLM. Or maybe we break free from the text-only interaction pattern and allow users to also provide visual feedback and adjustments. That changes the design of the solution but seems more like how such things might be in the future.