Last year I wrote about my mood tracking technique here. While I still have
similar approach of logging, over months I made a better visualizer for the
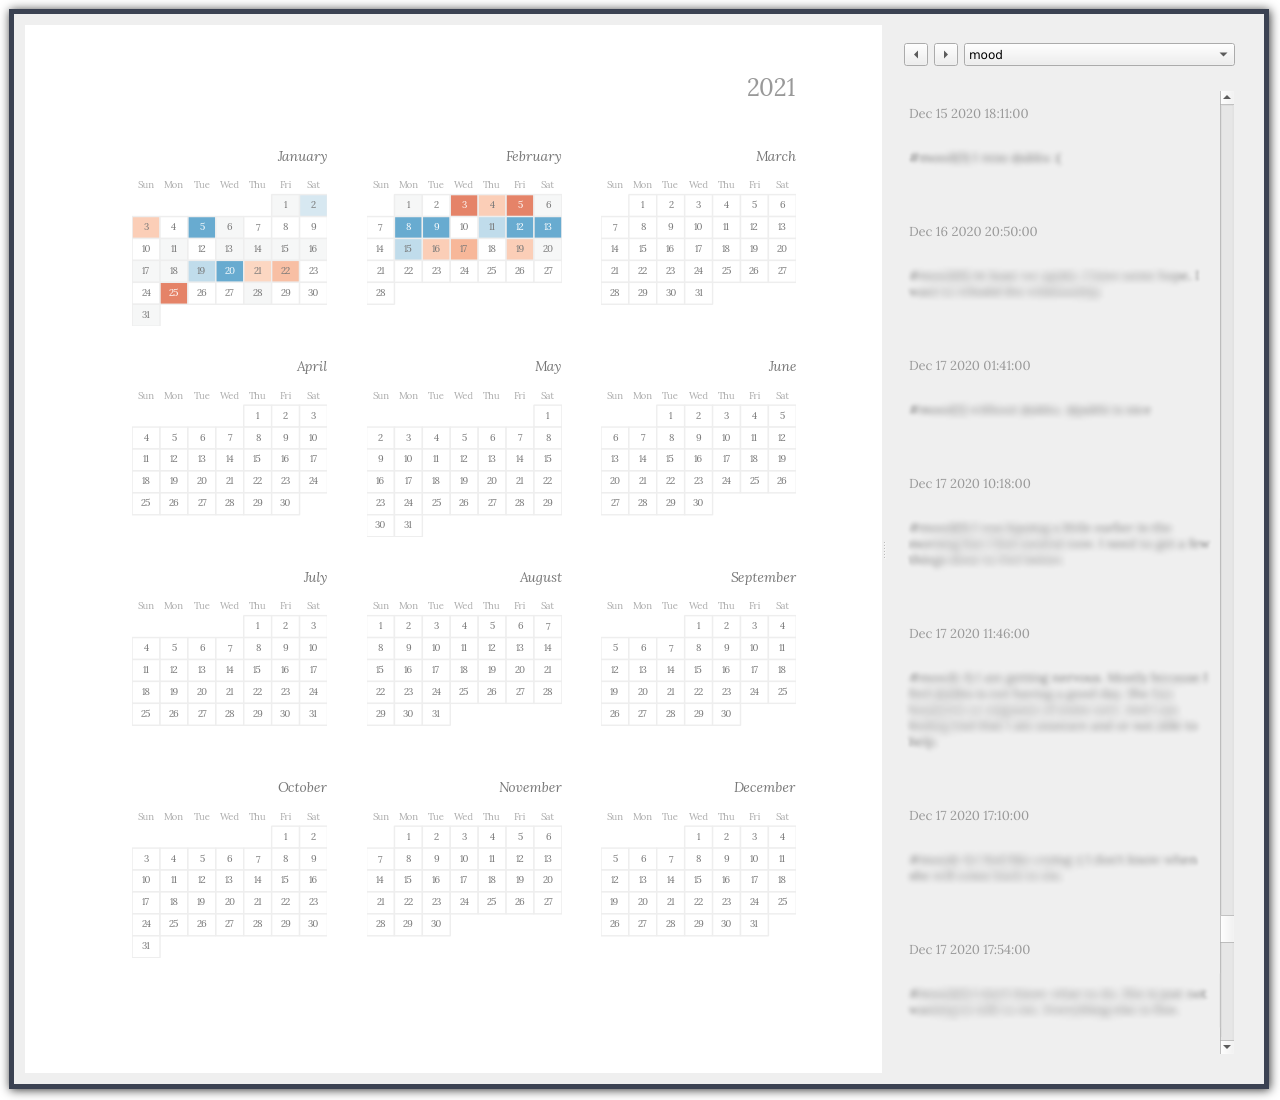
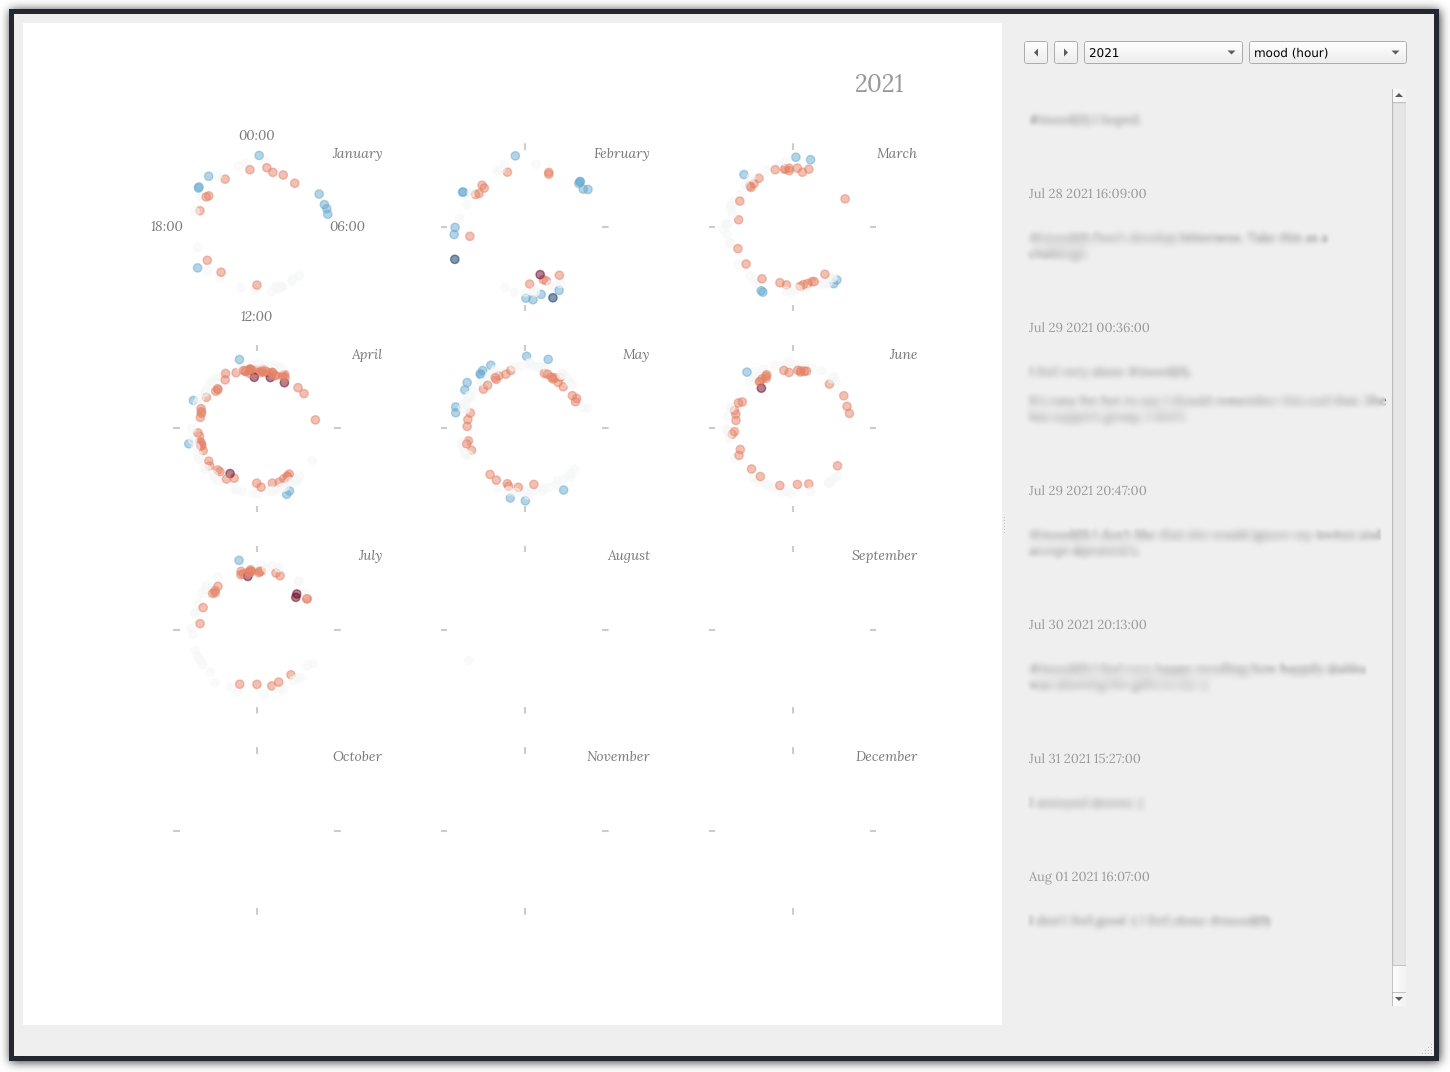
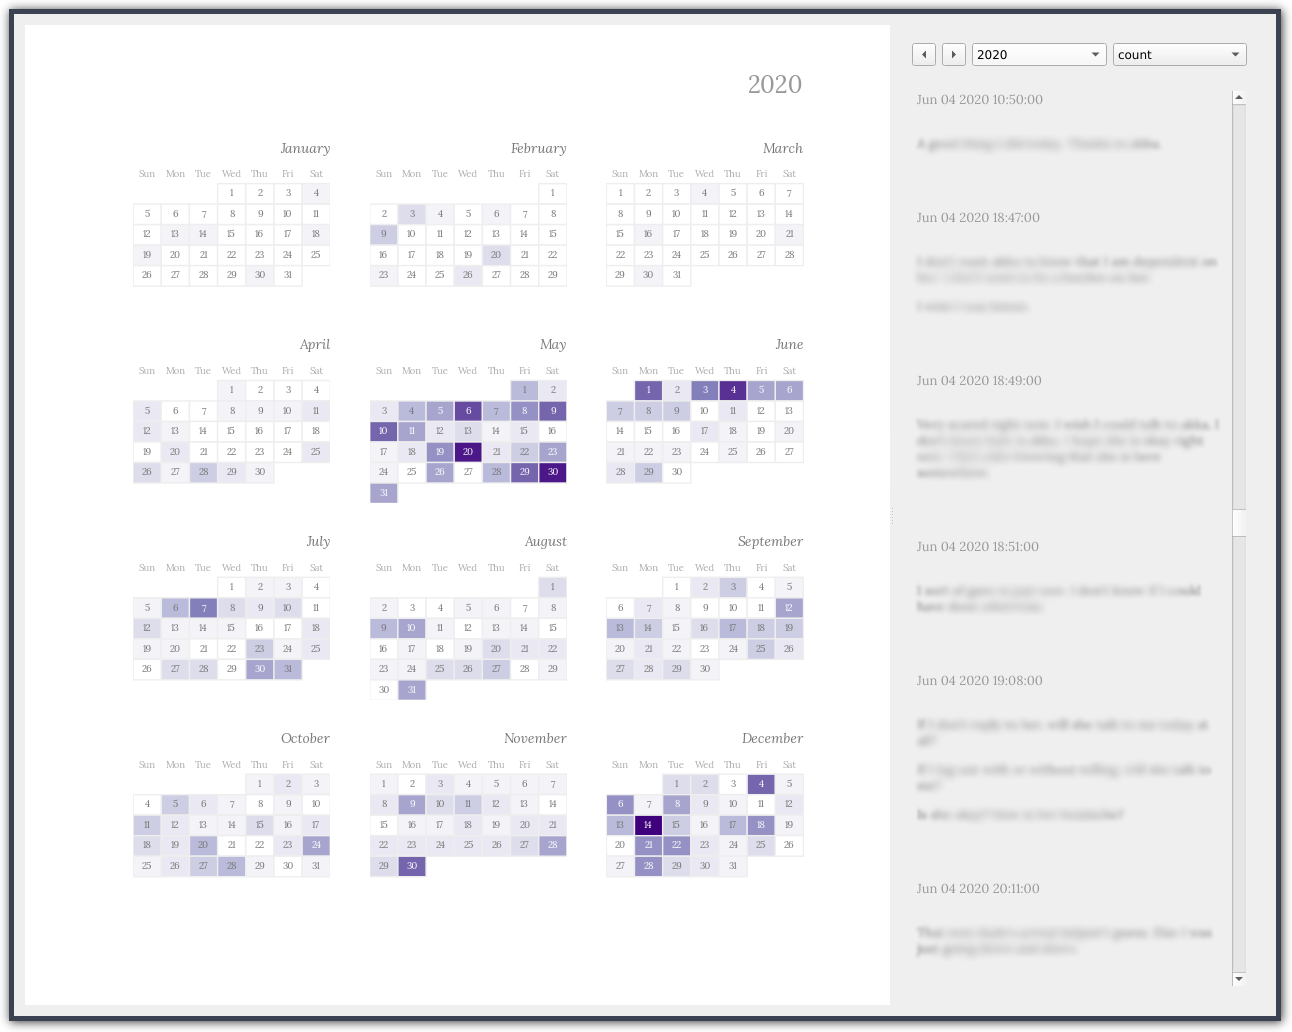
entries. It's called mento and is here. Pulling the screenshots from repository
here:
I might not try to generalize the approach of logging and visualization, but I
am interested in building a correlation finding mechanism in mento. My entries
have a lot of variables and trackers that could have interesting relations.